


- This event has already passed.
Pivot Table Course in Excel
Pivot Table Course in Excel
February 24 and 25, 2026 (8:30 AM to 12:30 PM)
Learn how to master Pivot Tables and create professional reports in Excel

Online – Live Streaming – Using the ZOOM Web Conferencing App
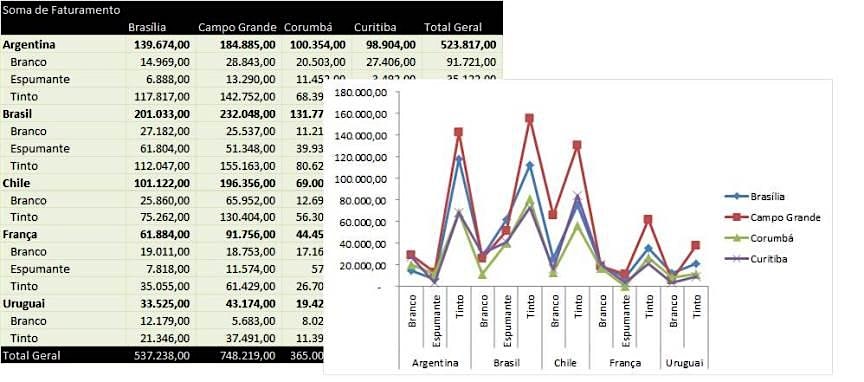
Pivot tables are one of Excel's most powerful tools for creating reports, consolidating data, and transforming data into information .
This 8-hour course aims to teach you how to work with pivot tables, starting from a basic level for those who are not yet familiar with the tool, and progressing to a more advanced understanding of its functions. By the end of the course, you will be able to use pivot tables to solve your day-to-day problems in your company.
Target Audience
Professionals from any field who need to analyze, summarize, and present data quickly: analysts, assistants, coordinators, managers, controllers, and other Excel users.
Syllabus for Pivot Tables in Excel
Data preparation and structuring
- Preparing the data for creating a pivot table
- Using tables as a basis for creating a pivot table
- Working with multiple databases in a pivot table using Power Query and table relationships
Creating a Pivot Table
- The fields, areas, and items of a pivot table
- Sorting and filtering data in a pivot table
- Creating reports from report filters
- Formatting PivotTable Values
- Drill Down – Double Click
- Working with empty cells
- Updating the pivot table and changing the data source
Layouts and Data Presentation
- Pivottable formatting and styles
- Setting up the layout: Subtotals, Grand Totals, Report Layout, and blank lines
Analysis Using Pivot Tables
- Automatic and manual grouping/ungrouping by date, text, and number
- Summarize values by: Sum, count, average, minimum, and maximum
- Display values as: % of Grand Total, % of, difference of, % Difference of, Cumulative Sum in, and % Cumulative Sum in
- Conditional Formatting in Pivot Tables
Creating dynamic charts
Using Data Segmentation (Slicers) to create dynamic reports, or Dashboards
Creating Professional Reports
- Using InfodadosTabelaPinâmica: Disabling it, Creating Simple Reports and Dynamic Reports
- Creating a Calculated Field
- Creating a Calculated Item
- Report Automation
In addition to advanced tips and detailed explanations of pivot table options.
Course Duration: 8 Hours
Instructor
Paulo José Mendes
A graduate engineer from USP (University of São Paulo), specializing in Production from the Vanzolini Foundation and holding a Master's degree in Quality from UPC Barcelona. Founding partner of Barcino Solutions – Excel for Business in 2010, having already taught Excel courses to companies of different sizes, such as: Johnson & Johnson, Boticário, Siemens, Ecorodovias, JBS, Polenghi, Coca-Cola, GE, among others.
Important Information
Date: February 24 and 25, 2026
Hours: 8:30 AM to 12:30 PM
Investment: R$ 1,150. Special offer for registrations paid by February 10, 2026: R$ 950. This price includes the course, materials, and an electronic certificate.
Format: Online Transmission – The course will be broadcast live and students can watch it on a computer with internet access. Students will be able to interact with the instructor, making comments and asking questions during the course.
Finished the training and still have some questions?
After completing the training, students will have 30 days to resolve their questions with the instructor via email.
This training can also be conducted in-company, either in person or online.
For more information about the Excel Pivot Table Course, contact us by phone at (11) 3230-2714 or access the link: https://bit.ly/3IpqwSc